Q3 2024 Market Review
Executive Summary
- Equity markets largely recovered from their early-August correction in Q3 and bond yields continued to fall.
- There was a notable rotation in market leadership favoring small caps, value stocks and real estate.
- The Fed started a new easing cycle with a half-percent rate cut, amid a late-cycle economy that has historically been characterized by more muted returns and greater recession risk.
- Investors should maintain neutral positioning while actively looking to rebalance and diversify portfolios.
Major asset classes have seen positive returns in 2024, with some leadership rotation in Q3
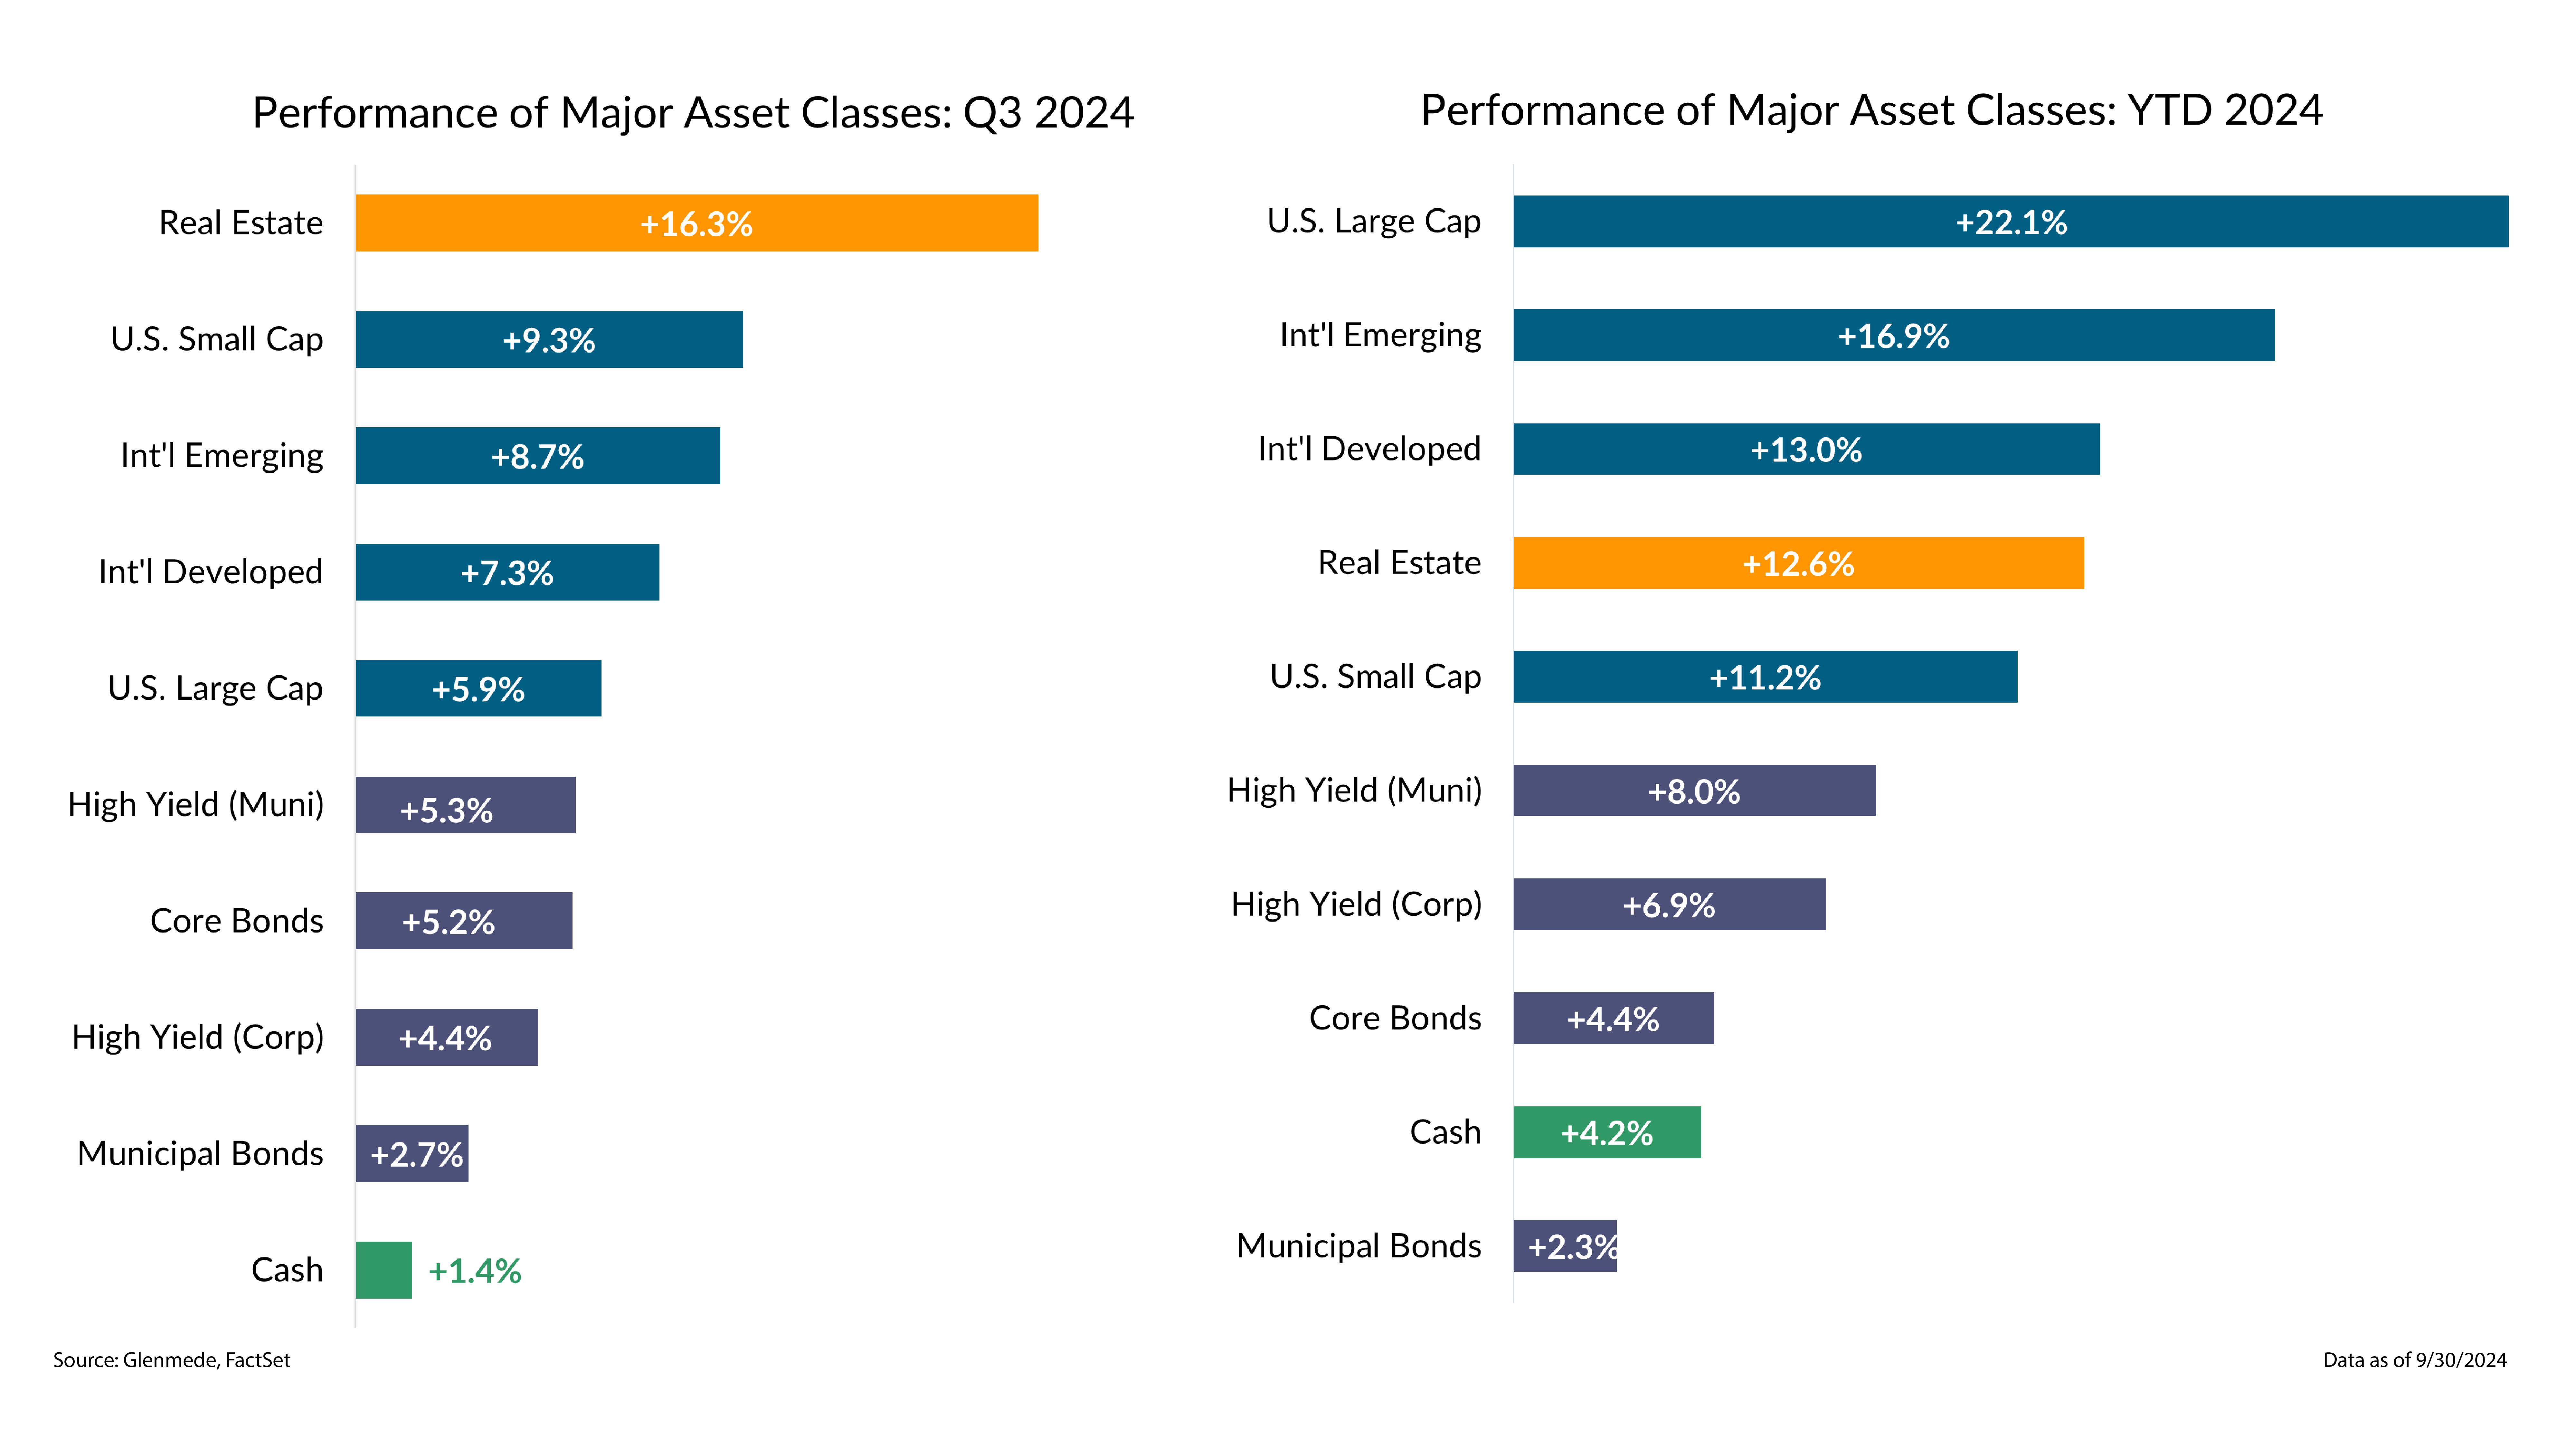
Shown are quarter-to-date and year-to-date total returns for various asset classes represented by the following indices: U.S. Large Cap (S&P 500), U.S. Small Cap (Russell 2000), Int’l Developed (MSCI EAFE), Int’l Emerging (MSCI EM), Real Estate (FTSE EPRA/NAREIT Developed), Core Bonds (Bloomberg U.S. Aggregate), Municipal Bonds (Bloomberg Municipal), High Yield (Corp) (Bloomberg U.S. High Yield Ba to B), High Yield (Muni) (Bloomberg Municipal High Yield), Cash (FTSE 3-Month Treasury Bills). Past performance may not be indicative of future results. One cannot invest directly in an index.
- Equity markets overcame a mid-quarter correction in Q3 and saw several out-of-favor portions of the market like small caps and value stocks outperform.
- Interest rates fell considerably, leading to strong total returns for bonds across the credit spectrum and between taxable and municipal equivalents.
The Fed took the first step in a rate cut campaign, a journey that could see rates near neutral in 2025
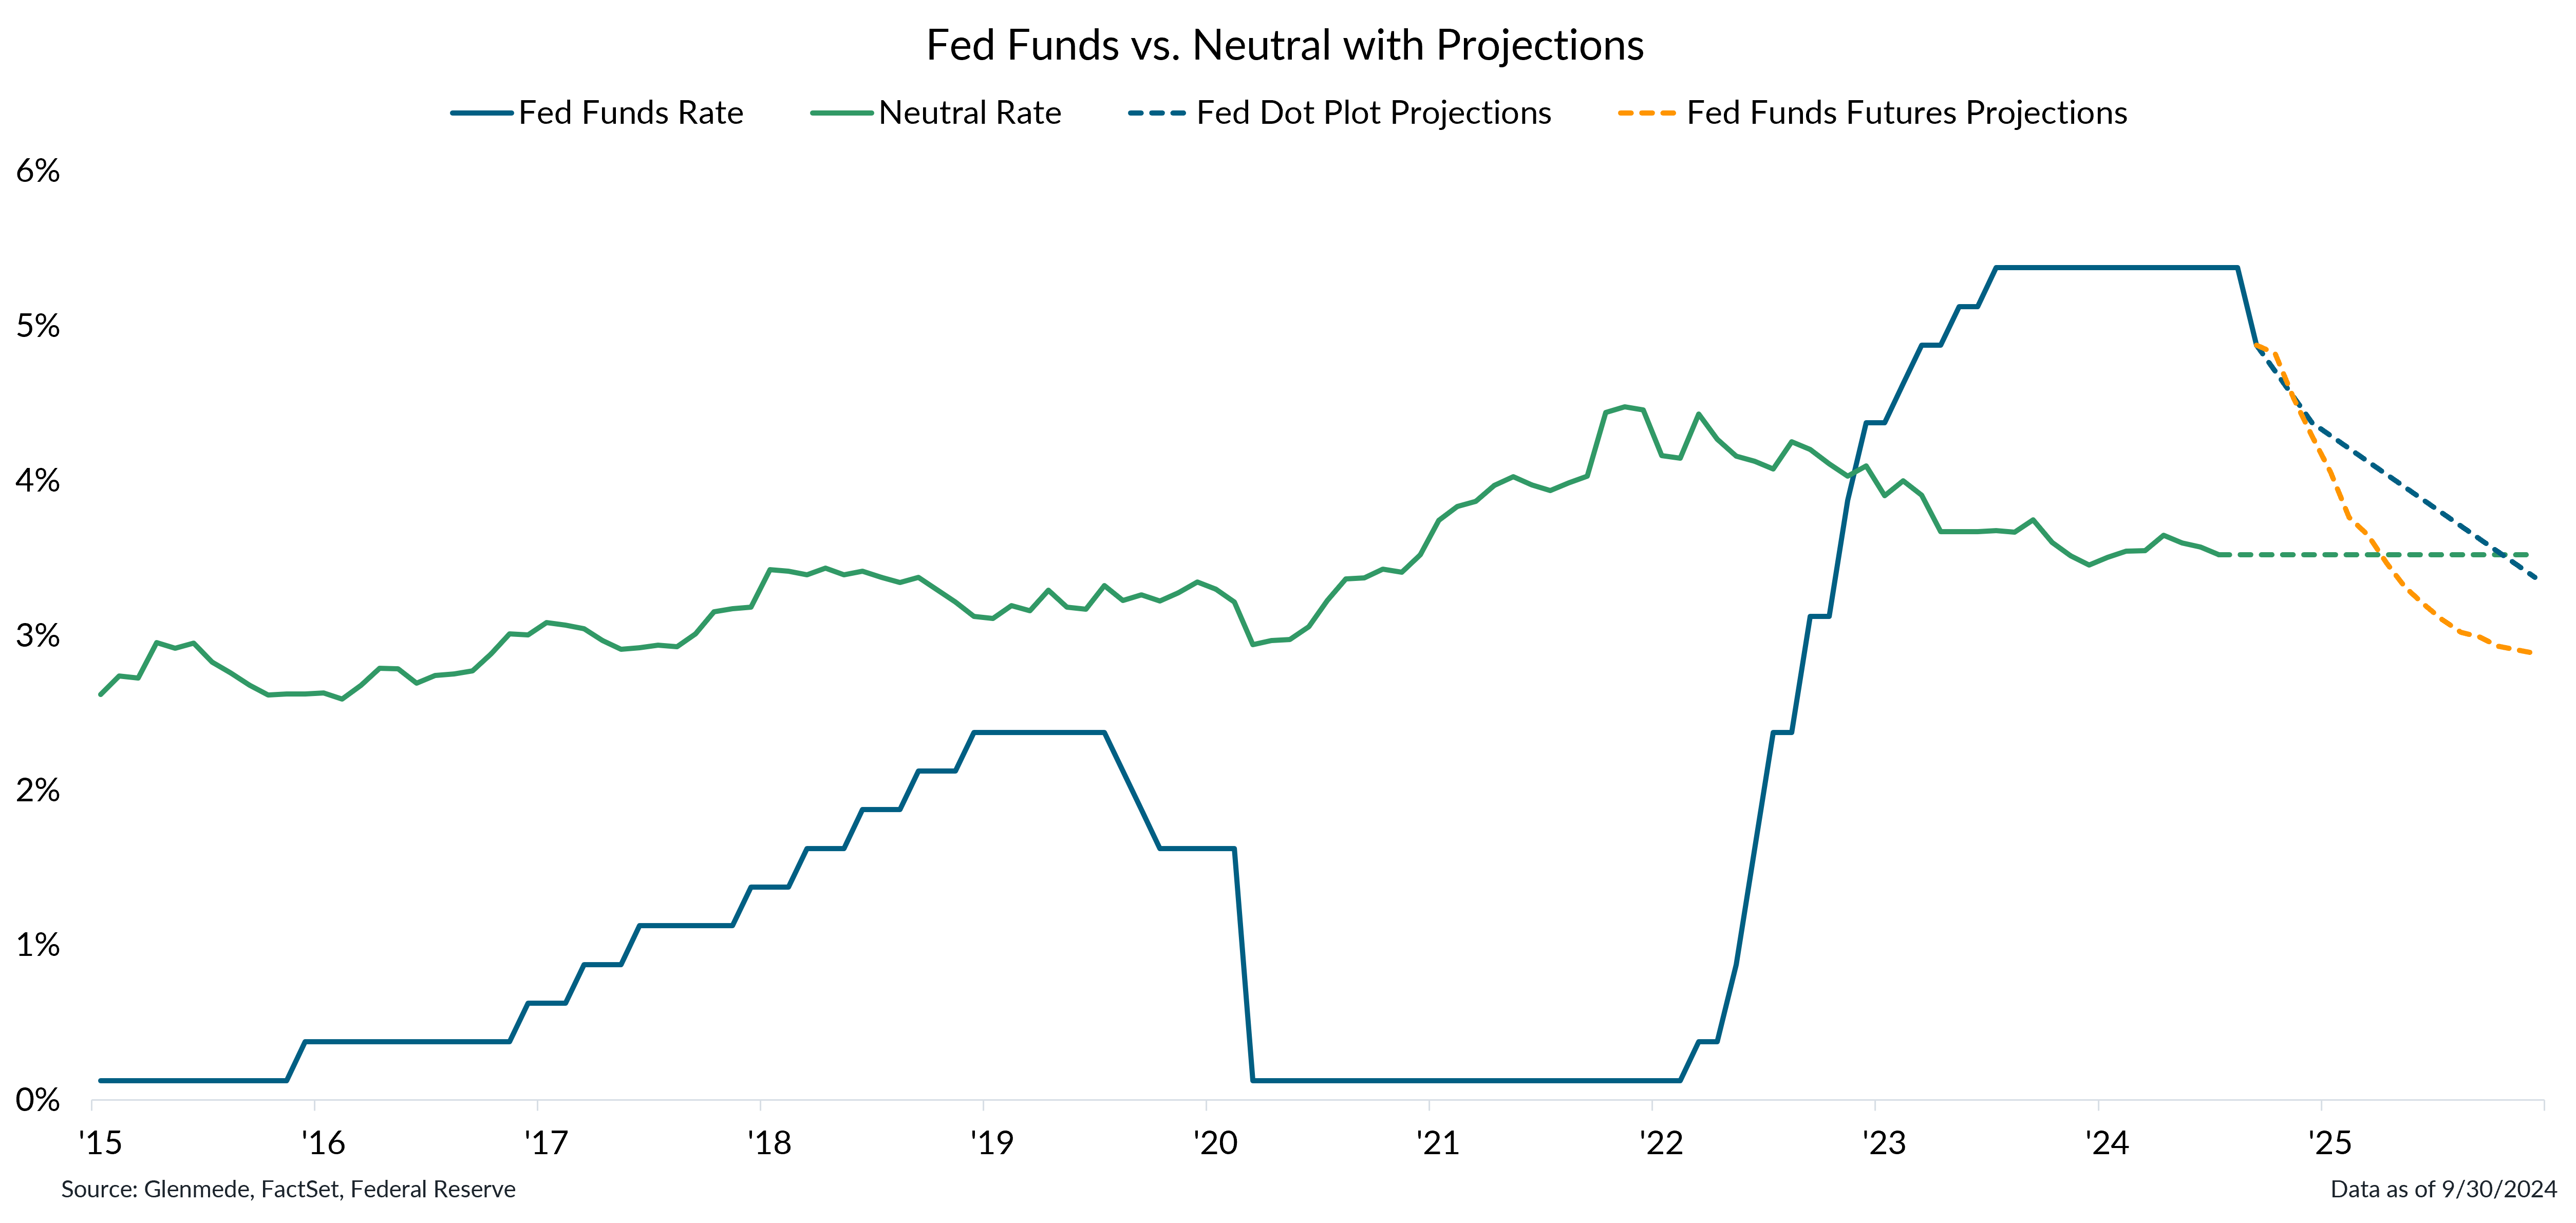
Data shown in green are Glenmede’s estimates of the neutral federal funds rate over time (i.e., the level of rates that is neither economically stimulative nor restrictive) based on expectations for real interest rates via the Holston-Laubach-Williams model and Glenmede’s 10yr inflation expectations. Fed Funds Rate in blue is the target rate midpoint. The dashed blue line represents projections based on the median response in the Federal Open Market Committee’s latest dot plot survey. The dashed yellow line represents projections based on fed funds futures. Actual results may differ materially from projections.
- The main event for markets in Q3 was the Fed initiating a new easing cycle, beginning with a half-percent rate cut during the September Federal Open Market Committee meeting.
- Perhaps just as important as the rate decision itself was the update to the Fed’s dot plot, with the median respondent now expecting rates in the neighborhood of neutral in 2025.
The U.S. economy remains in late cycle, characterized by more muted returns and greater recession risk.
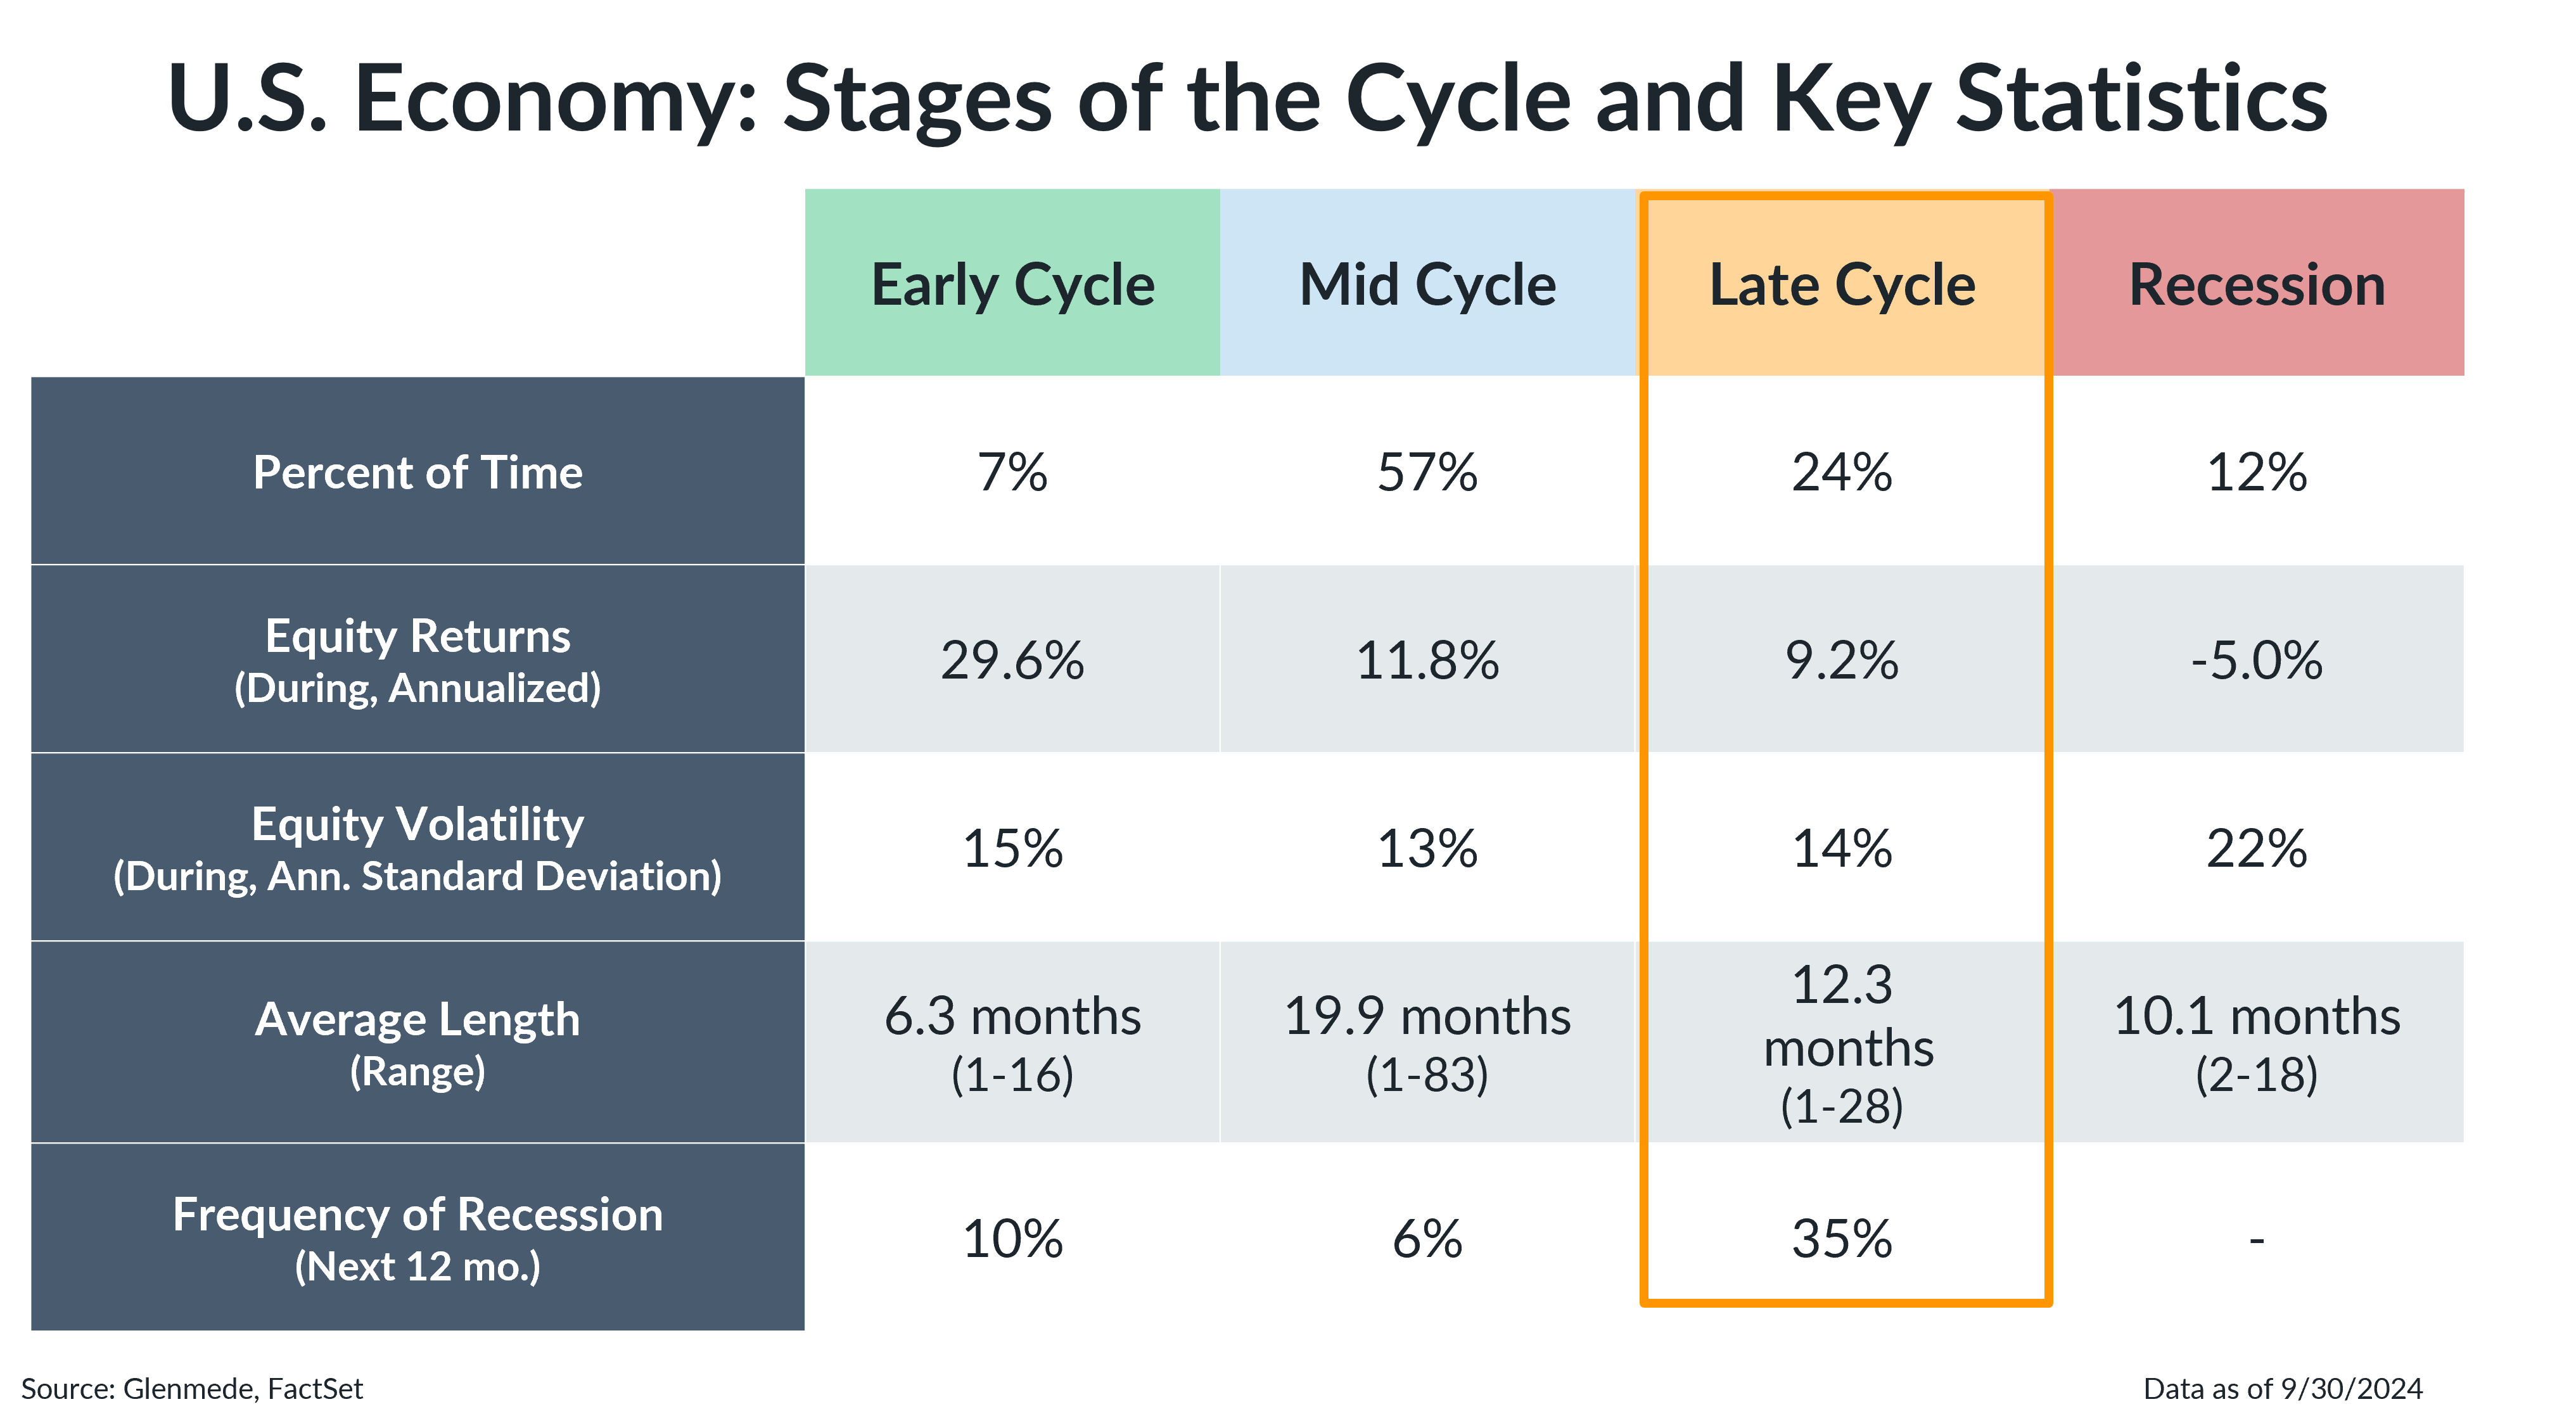 The table shown represents the frequency with which the U.S. economy sits in the various stages of economic expansion/recession since 1962, based on a Glenmede analysis of typical economic behavior from a handful of leading and excess indicators. Recession refers to periods of economic downturn, Early Cycle refers to rebounds from recessions, Mid Cycle refers to ongoing growth up to the economy’s potential and Late Cycle refers to periods where the economy is operating at or above potential. All references to equity returns refer to performance of the S&P 500 Index. The S&P 500 is a market capitalization weighted index of large cap stocks in the U.S. Past performance may not be indicative of future results. One cannot invest directly in an index.
- The economy remains in late cycle, which has historically been characterized by more muted returns and greater recession risk.
- The combination of an economy in late cycle and premium valuations in equities suggests that investors should maintain neutral positioning while actively looking to rebalance and diversify portfolios.